Data profiling is an important but often overlooked component in ETL pipelines or exploratory data analysis (EDA). It provides a way to look into the data to understand the structure, inter-relationships and dependencies with each other. It can also uncover any data quality issues that may stem inside a data pipeline during migration, preventing data corruption and ensuring overall quality of data.
Data profiling can provide statistical measures like min, max, median for number type fields. It can check for data types, inherent patterns, distributions, recurring values in a text field or check if the data follows the expected patterns (e.g. phone numbers are saved as 123-456-7890).
There does not seem to be very many open source options when it comes to reliable data profiling. One of the names that comes up often is Talend Open Studio. Talend does not make it clear if the open source version of the data integration tool contains the data profiling feature, but upon further investigation it seems they have removed that feature since version 7.3 (current version is 8.0.1). I downloaded and installed the open-source version and indeed there is no option to run data quality.
Another name that comes up is called Pentaho Data Integration Community Edition, however the download redirects to SourceForge page and the github repo seems to have the last release in 2015. I also could not find any documentation on how to run data profiling in their open source version, so it seems one would entirely have to rely on the community if there is any issues.
pandas-profiling
Then I found pandas-profiling, an open source Python library that can run profiling on top of a pandas dataframe. Because most data analysts and data scientists already work on pandas, the awesome Python data analysis library, this is a must try to see the result. It has good documentation to get started and the github repo shows being actively worked on, which is another promising sign for continuous improvement.
In this example, we will load a large CSV file containing 5 million HR records for sample employees. The example CSV can be downloaded here. The CSV is loaded into a table in PostgreSQL, however the following could easily used in Snowflake or Redshift, two of the popular cloud data warehouse systems.
We can create a table in the database and load the data using the following command:
create table test.employee(
    emp_id bigint,
    name_prefix text,
    first_name text,
    middle_initial text,
    last_name text,
    gender text,
    e_mail text,
    fathers_name text,
    mothers_name text,
    mothers_maiden_name text,
    date_of_birth timestamp without time zone,
    time_of_birth time without time zone,
    age_in_yrs decimal,
    weight_in_kgs decimal,
    date_of_joining date,
    quarter_of_joining text,
    half_of_joining text,
    year_of_joining int,
    month_of_joining int,
    month_name_of_joining text,
    short_month text,
    day_of_joining int,
    dow_of_joining text,
    short_dow text,
    age_in_company_(years) decimal,
    salary decimal,
    last_percent_hike text,
    ssn text,
    phone_no text,
    place_name text,
    county text,
    city text,
    state text,
    zip text,
    region text,
    user_name text,
    password text
)

copy test.employee(
    emp_id, name_prefix, first_name, middle_initial, last_name,gender,
    e_mail, fathers_name, mothers_name, mothers_maiden_name,
    date_of_birth, time_of_birth, age_in_yrs, weight_in_kgs,
    date_of_joining,quarter_of_joining,half_of_joining,year_of_joining,
    month_of_joining, month_name_of_joining, short_month, day_of_joining,
    dow_of_joining, short_dow, age_in_company_years, salary,
    last_percent_hike, ssn, phone_no, place_name,
    county, city, state, zip,
    region, user_name, password)
from 'C:\Users\aahmed\Downloads\Hr5m\Hr5m.csv'
delimiter ','
csv header;
Now let us write a short script to load this table into pandas and profile using pandas-profiling. The library can be installed quite simply by:
$ pip install -U pandas-profiling[notebook]Now let us first create a configuration file that contains the connection details to the database. We can name this file as database.ini .
[postgresql]
host=127.0.0.1
port=5432
database=database
user=user
password=password
And a small piece of code to load the configuration, which we can name as config.py.
#!/usr/bin/python
from configparser import ConfigParser

def config(file='database.ini', section='postgresql'):
    parser = ConfigParser()
    parser.read(file)
    conf = {}
    items = parser.items(section)
    for item in items:
        conf[item[0]] = item[1]
    return conf
Finally, we can write the code to use this configurations to connect to database to load the table into a pandas dataframe and run profiling using pandas-profiling. At this time we are loading only 1000 rows to get a small sample of the whole data. Once we are satisfied with the configuration, we can run profiling on the whole table.
#!/usr/bin/python
import psycopg2
import pandas as pd
from pandas_profiling import ProfileReport
from config import config

with psycopg2.connect(**config()) as con, con.cursor() as cur:
    sql = """select * from test.employee limit 1000"""
    df = pd.read_sql_query(sql=sql, con=con)
    profile = ProfileReport(df=df, title="Profiling", explorative=True)
    profile.to_file(output_file='report.html')
When we run the code, it will generate a report.html file in the same directory. The generated file can be found here (save locally and open with a browser).
pandas-profiling supports several data types. Let us look at some of them:
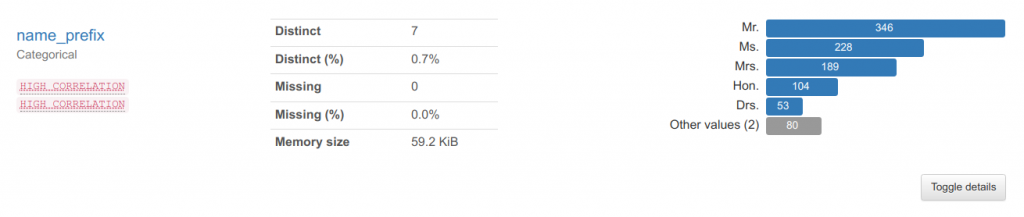
Categorical
The name_prefix is one of the text type columns, which falls into the categorical type. If we look at the result, it has found 7 types of distinct categories for name prefix. It also found that there are no NULLs in this sample.
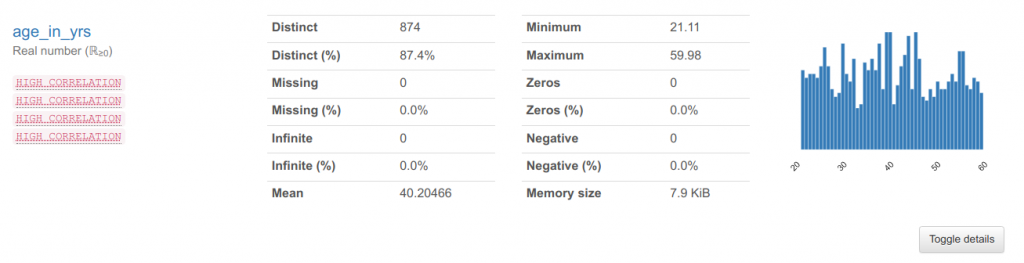
Numerical
Next, let us look at a numerical field, age of the employees in years. We can see that the minimum age is 21.11 and the maximum is 59.98 with the mean being at 40.20.
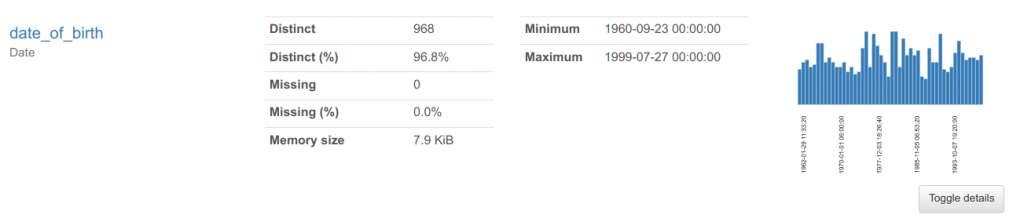
Date
We can use the date of birth of the employees to inspect the result for a date field. It again finds the minimum and maximum and shows that there are no missing values in the selected sample. One thing I noticed is that if the data type is set to datetime (timestamp), pandas-profiling correctly recognises as a date type, but if the data type is set to a date or time in the database, it marks them as unsupported. It would be good if future version adds the ability to identify all date/time data types.
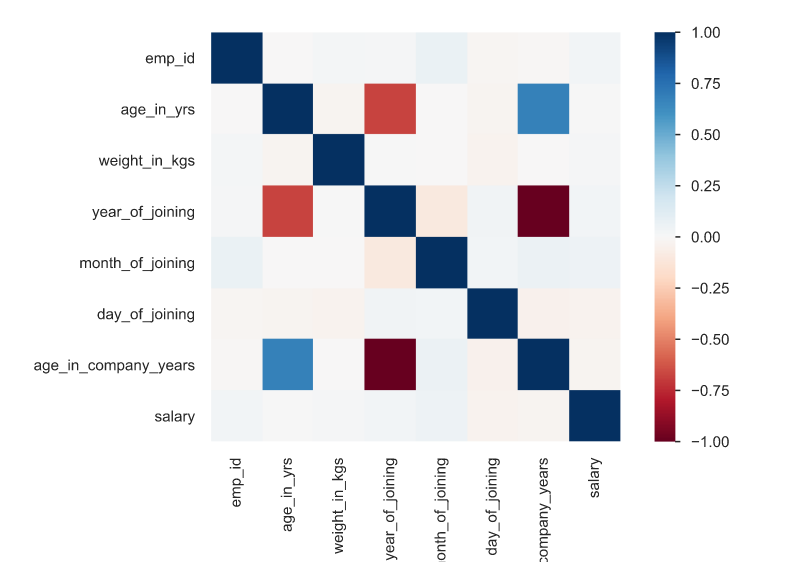
On top of the column wise profiling, it also gives a matrix showing the correlations between the columns. For example, age_in_company_years has good correlation with employees age_in_years which makes sense, as older employees highly likely stayed longer at the company.
Please feel free to play with the pandas-profiling and let me know your impressions or if you use any other open-source tools that provide more features. Thanks for reading.
Be First to Comment